Webfleet Solutions and Geotab tell us about commercial mobility recovery (Part II)
The dashboard developed by Geotab and Webfleet Solutions aims to monitor and analyze data on the commercial mobility recovery after the lockdown period due to the pandemic in several European and North American countries. The data comes from around 100,000 anonymous customers. We have published here the first part of the interview with Marco Federzoni, Sales […]
The dashboard developed by Geotab and Webfleet Solutions aims to monitor and analyze data on the commercial mobility recovery after the lockdown period due to the pandemic in several European and North American countries. The data comes from around 100,000 anonymous customers. We have published here the first part of the interview with Marco Federzoni, Sales Director Italy of Webfleet Solutions and Fabio Saiu, Leasing and Renting European Director of Geotab, to whom we asked some questions about the functioning of the dashboard and the first indications that arrived. This is the second and last part.
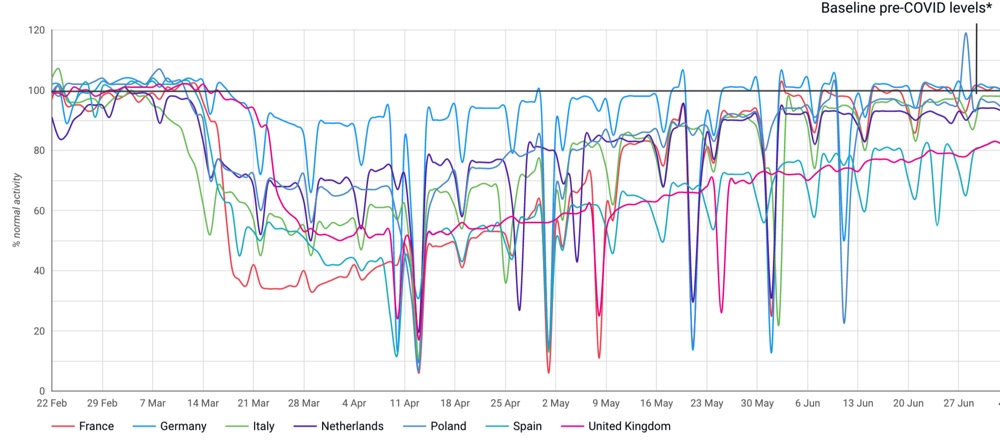
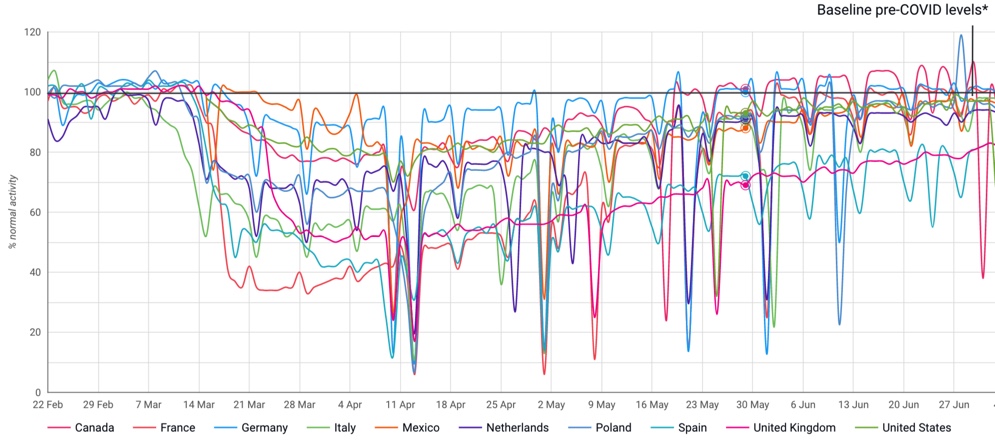
*The screenshots published here were generated by the dashboard and refer to the 29/6 update
An eye on commercial mobility recovery
Are there substantial differences between the trend in commercial traffic in Europe and North America, or is the recovery comparable?
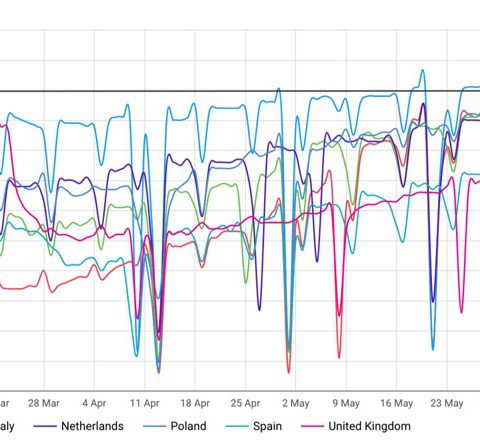
Fabio Saiu, Leasing and Renting European Director at Geotab: «First of all, I would like to underline that we strongly believe in the potential of using data for the common good, helping customers, companies and governments to determine where and when to allocate resources while the supply chain returns to normal, in Italy and abroad. According to data provided by Geotab and Webfleet Solutions’ commercial mobility recovery dashboard, commercial vehicle activity in Europe fell by a maximum of 36% during the pandemic, while North American commercial vehicle activity fell by only 20% at its peak. However, Europe showed faster levels of recovery with commercial vehicle activity growing faster than North America at its peak».
What kind of feedback are you receiving on the initiative? And do you think the project can continue, perhaps in other ways, in the future and independently of the Covid emergency?
Marco Federzoni, Sales Director Italy of Webfleet Solutions: «Today more than ever, access to anonymous and aggregated data is a vital component in the analysis of the impacts on our economy. The dashboard helps companies and customers, for example, to understand how their business levels compare to regional regulations, so that they can shape their recovery plans with greater confidence. In addition, governments can use these data to understand the immediate impact and inform future policy decisions.
The dashboard will be updated weekly for the near future. No deadline has been set, but we expect to continue for at least six months. The dashboard is explicitly designed to display the impact of COVID-19. Its goal is to visualize the impact on the fleet activity of different industries in different countries. However, we will consider future opportunities to use this data and resources to help our communities and key stakeholders in the recovery process».